Statistical Weather Signals For Prediction Markets

Weather Signals for Prediction Markets

LantzNet PolyWeather Signals compares multiple forecast models, observed weather history, and live market conditions to identify statistically favorable YES and NO temperature opportunities.

  • Multi-source forecast comparison
  • City-level temperature probability modeling
  • YES and NO opportunity detection
  • Forecast-vs-market mismatch analysis
  • Designed for research, transparency, and disciplined decision-making

Use the mobile dashboard for a cleaner phone-friendly view of city signals, YES/NO opportunities, and temperature ranges.

Signal Intelligence
Statistical weather analytics signal visualization

What We Do

Weather probability analytics designed for disciplined market research.

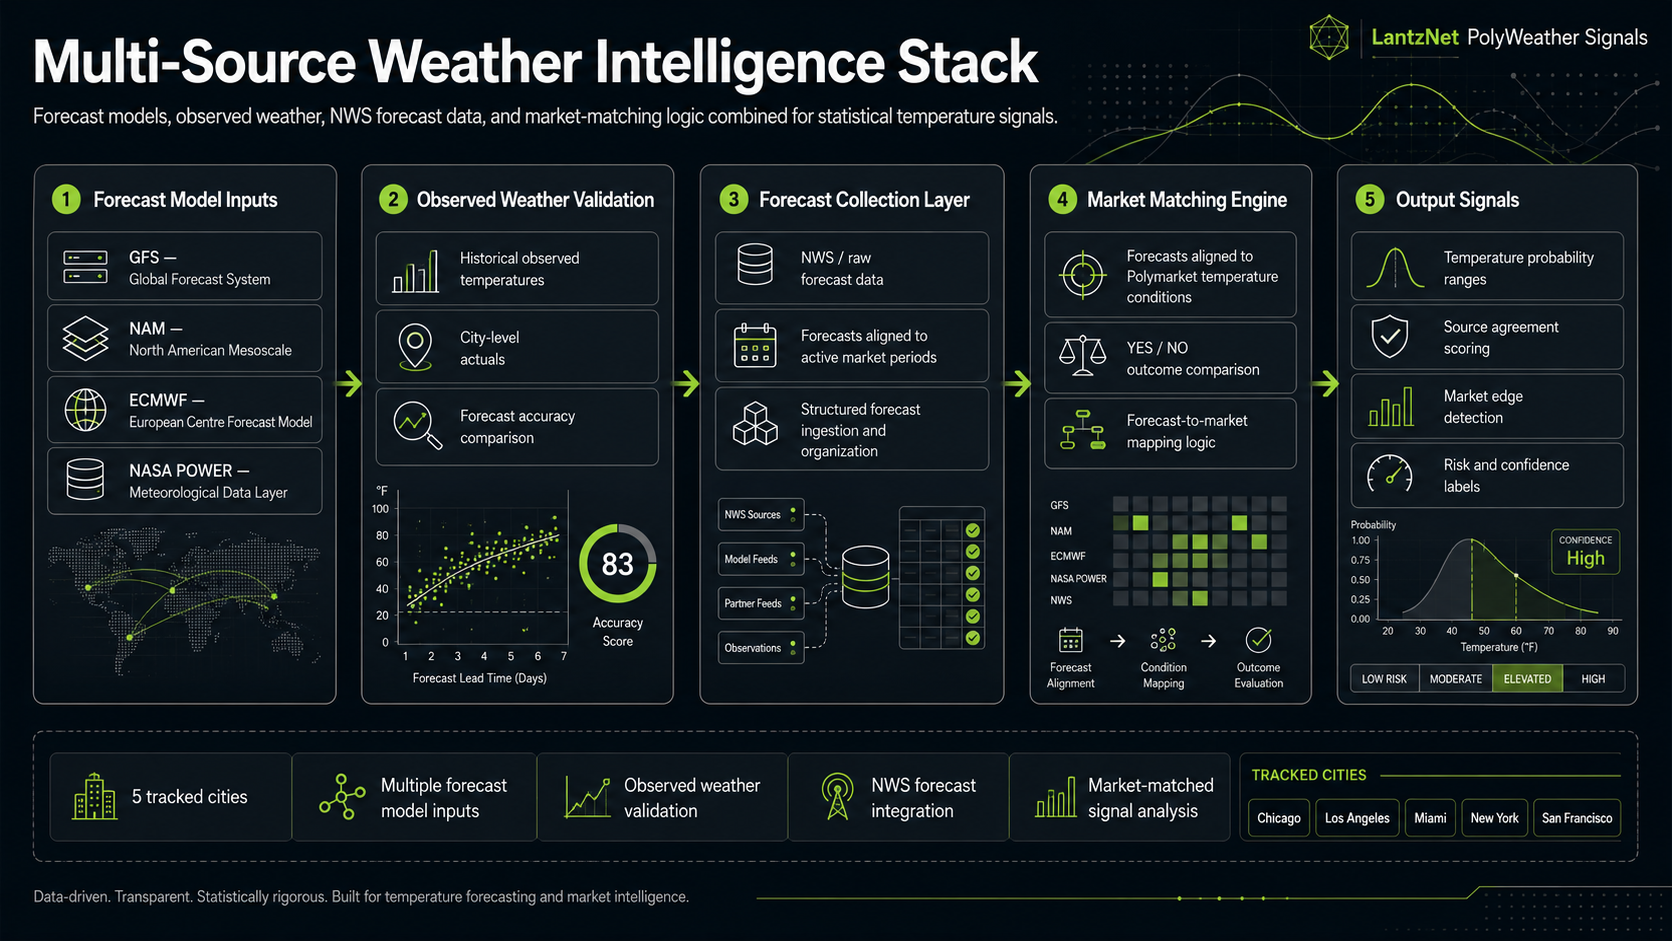
PolyWeather Signals organizes forecast, observed weather, and market data into readable temperature-market signals. The platform is designed to help users compare forecast probability against market pricing without relying on a single weather source.

  • Gather multi-source weather and market data
  • Model temperature probabilities by range
  • Compare forecast probability against market odds
  • Surface YES and NO opportunities with risk context

Forecast Data Stack

Built on Multiple Forecast and Market Data Layers

LantzNet does not rely on a single weather app forecast. Each supported city is analyzed using forecast model guidance, observed weather history, raw forecast records, and forecast-to-market matching data.

GFS

Global Forecast System

Broad global forecast model guidance used for temperature range analysis.

NAM

North American Mesoscale

Regional North American model guidance used for short-range temperature comparison.

ECMWF

European Centre Forecast Model

Medium-range forecast guidance used as an additional independent model layer.

NASA POWER

NASA POWER Meteorological Data

Additional meteorological data layer used for weather context and comparison.

Observed

Observed Weather

Historical actual temperatures used to compare forecasts against real outcomes.

NWS

Raw Forecast Collection

Structured forecast data used to support city-level temperature analysis.

Market Match

Market Matching Engine

Forecast data aligned to Polymarket-style temperature conditions and YES/NO ranges.

Signal Intelligence

From Forecast Data to Market Signals

LantzNet combines model forecasts, observed weather, raw forecast records, and market-condition matching to produce statistical temperature signals for prediction-market research.

Multi-Source Weather Intelligence Stack infographic showing forecast data flow into market signal analysis

Multi-Model Forecasting

Compare GFS, NAM, ECMWF, NASA POWER, and observed weather instead of relying on one forecast.

Market-Matched Analysis

Align forecast data to Polymarket temperature conditions and YES/NO ranges.

Risk-Aware Signals

Display confidence, source agreement, and potential edge without promising outcomes.

City Coverage

Supported City Coverage

PolyWeather Signals currently focuses on major temperature-market cities and compares each location across multiple forecast and observed-weather layers.

  • Chicago, IL
  • Los Angeles, CA
  • Miami, FL
  • New York, NY
  • San Francisco, CA

Methodology

How the Signal Works

A plain-English process for turning weather and market data into temperature-market signals.

Step 1

Collect Forecasts

Gather forecast guidance, observed weather, and market data.

Step 2

Normalize Temperatures

Convert inputs into comparable city-level temperature ranges.

Step 3

Compare Source Agreement

Evaluate whether sources cluster around the same outcome or disagree.

Step 4

Match to Market Conditions

Align forecast probabilities with YES and NO temperature ranges.

Step 5

Surface Potential Edge

Highlight where forecast probability and market pricing appear meaningfully different.

Why It Matters

LantzNet vs Generic Weather Apps

Capability LantzNet PolyWeather Signals Generic Weather Apps
Source View Multi-source forecast comparison General consumer forecast
Probability View Temperature-range probabilities Point forecasts and summaries
Market Context Forecast probability compared with market pricing No market-pricing context
Decision Support YES/NO signal framing with risk context General weather planning
Built For Statistical Advantage

Simplified Probability Distribution

Visual clarity for confidence zones and tail-risk interpretation, supporting faster decision cycles when markets shift.

Dashboard Preview

A focused workspace for probabilities, edge ranking, and market comparison.

The dashboard combines range probabilities, YES/NO outcomes, edge analysis, and live comparisons in one readable interface tuned for fast interpretation.

LantzNet

Sample display only — not live signal data.